U.S. Cable & Internet Market Size and Household Spending Report 2025
U.S. households collectively spend approximately $164 billion annually on cable and internet services, with a median household bill per month of $121. This expenditure represents about 4% of the total $4.55 trillion spent on household bills each year.
With 73% of U.S. households subscribing to cable and internet services, understanding the dynamics of this market is crucial for consumers, service providers, and policymakers alike.
The doxoINSIGHTS analysis reviews household payments for cable and internet bills across 97% of U.S. zip codes to determine market size. The report provides details on household spending, the percentage of households paying each bill, and median monthly and annual costs by state and in the 50 largest U.S. cities, as well as cities with populations over 40,000.
Using aggregate, anonymized data, doxoINSIGHTS offers analysis of consumer payments on a rolling 12-month basis, with monthly updates. For the latest insights on U.S. household bill expenses, visit doxo.com/w/explore and select a state, county, or city.
Key Findings
1. Total Cable and Internet Consumer Market Size: $164 Billion Annually
The cable and internet sector accounts for a significant portion of household expenditures, highlighting its essential role in daily life and the economy.
2. Median Monthly Cable and Internet bill payment: $121
Households allocate approximately $121 per month to cable and internet services, reflecting the importance of connectivity in modern living.
3. Percent of Households: 73%
A vast majority of households (73%) maintain cable and internet subscriptions.
4. Percent of Household Bill Pay Expense: 4%
Cable and internet expenses amount to 4% of consumers’ annual household bill pay costs.
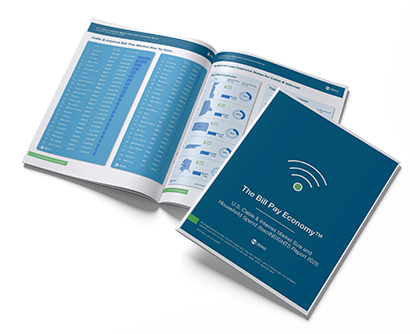
U.S. Cable & Internet Market Size and Household Spend Report
Download the full report for a comprehensive look into the cable and internet industry, with a deep dive into category market size and median spend at the national, state, and regional level.
Regional Insights
While the national median provides a broad overview, regional variations exist in cable and internet spending. Factors influencing these differences include service availability, competition among providers, and regional pricing strategies.
Top 5 Most Expensive States for Cable & Internet
1. Delaware
The median monthly bill for cable and internet services in Delaware is $157, which amounts to $1,313 per year across all U.S. households.¹
70% of Delaware households maintain a cable & internet subscription.
Top 5 Most common billers in Delaware for cable and internet services are DIRECTV, Xfinity, SiriusXM Satellite Radio, DISH Network, and Verizon.
2. Rhode Island
The median monthly bill for cable and internet services in Rhode Island is $150, which amounts to $1,091 per year across all U.S. households.¹
61% of Rhode Island households maintain a cable & internet subscription.
Top 5 Most common billers in Rhode Island for cable and internet services are Cox Communication, DIRECTV, Verizon, SiriusXM Satellite Radio, and DISH Network.
3. South Dakota
The median monthly bill for cable and internet services in South Dakota is $147, which amounts to $1,315 per year across all U.S. households.¹
75% of South Dakota households maintain a cable & internet subscription.
Top 5 Most common billers in South Dakota for cable and internet services are DIRECTV, Xfinity, SiriusXM Satellite Radio, DISH Network, and Verizon.
4. Tennessee
The median monthly bill for cable and internet services in Tennessee is $143, which amounts to $1,310 per year across all U.S. households.¹
76% of Tennessee households maintain a cable & internet subscription.
Top 5 Most common billers in Tennessee for cable and internet services are DIRECTV, DISH Network, AT&T U-verse, Xfinity, and Charter Communications.
5. Alaska
The median monthly bill for cable and internet services in Alaska is $143, which amounts to $1,211 per year across all U.S. households.¹
71% of Alaska households maintain a cable & internet subscription.
Top 5 Most common billers in Alaska for cable and internet services are Alaska Communications Systems, DISH Network, AT&T, GCI Communication, and DIRECTV.
Top 5 Most Expensive Cities for Cable & Internet
1. Pittsburgh
The median monthly bill for cable and internet services in Pittsburgh is $222, which amounts to $1,508 per year across all U.S. households.¹
57% of Pittsburgh households maintain a cable & internet subscription.
Top 5 Most common billers in Pittsburgh for cable and internet services are DIRECTV, Xfinity, DISH Network, SiriusXM Satellite Radio, and Verizon.
2. Milwaukee
The median monthly bill for cable and internet services in Milwaukee is $192, which equates to $1,913 per year across all U.S. households.¹
83% of Milwaukee households maintain a cable & internet subscription.
Top 5 Most common billers in Milwaukee for cable and internet services are Spectrum Cable, AT&T U-verse, SiriusXM Satellite Radio, DIRECTV, and DISH Network.
3. Denver
The median monthly bill for cable and internet services in Denver is $186, which equates to $1,492 per year across all U.S. households.¹
67% of Denver households maintain a cable & internet subscription.
Top 5 Most common billers in Denver for cable and internet services are DIRECTV, SiriusXM Satellite Radio, Xfinity, CenturyLink, and DISH Network.
4. Portland
The median monthly bill for cable and internet services in Portland is $170, which equates to $1,463 per year across all U.S. households.¹
72% of Portland households maintain a cable & internet subscription.
Top 5 Most common billers in Portland for cable and internet services are DIRECTV, SiriusXM Satellite Radio, Xfinity, Frontier Communications, and DISH Network.
5. Charlotte
The median monthly bill for cable and internet services in Charlotte is $165, which amounts to $1,599 per year across all U.S. households.¹
81% of Charlotte households maintain a cable & internet subscription.
Top 5 Most common billers in Charlotte for cable and internet services are DIRECTV, DISH Network, Spectrum Cable, AT&T U-verse, and SiriusXM Satellite Radio.
How to utilize doxoINSIGHTS for bill pay management
The cable and internet market remains a vital component of household expenditures in the U.S. Understanding median bill pay costs can aid in personal budgeting and identifying potential savings. You can use this report for service evaluation to assess your current service plan. Data on household spending can also guide investments in broadband infrastructure, especially in underserved areas.
doxoINSIGHTS leverages doxo’s unique, aggregate, anonymized bill pay data consisting of actual bill payment activity to confirmed household service providers across the country.
The U.S. Cable & Internet Market Size and Household Spending Report breaks out the household spending market size; percentage of households that pay each bill; and median monthly and annual bill pay costs by state, the 50 largest U.S. cities based on number of households, and those cities with 40k or more residents.
Download the Full Report: U.S. Cable & Internet Market Size and Household Spending Report 2025 (PDF)
Data is sourced from doxoINSIGHTS and reflects a 12-month overview of actual consumer payment data as of March 2025. For the most up-to-date analysis, please visit doxo.com/w/explore and search by state, county, or city.
¹ The calculation for the median annual bill cost per U.S. household is adjusted to reflect the percentage of households that carry the bill: Median Monthly Bill x Percentage of Households with the Bill x 12 months per year = Median Annual Cost per U.S. Household.

